Skip to content
stylyBusiness

Analysis & development

We analyse how your business works and build your digital tools.

Custom software, automation, data and AI. We start by watching how you work, then build what saves you time.
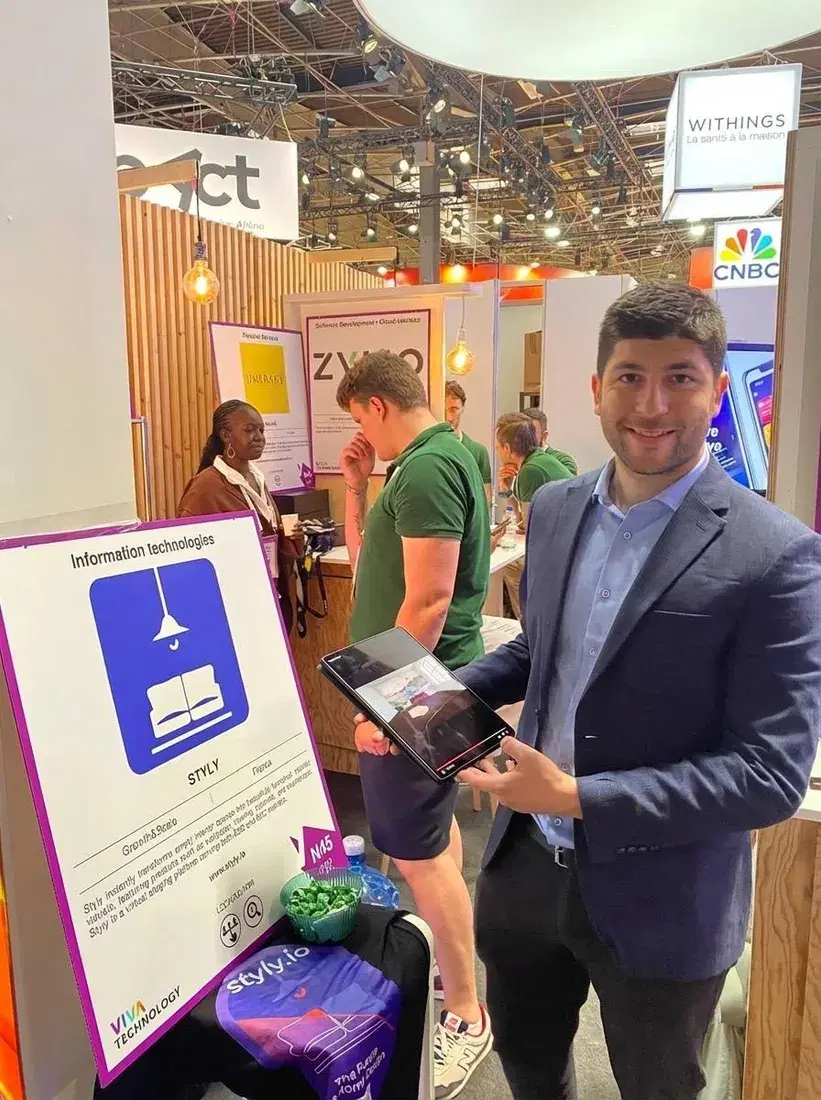
Duhan Koyuncu presenting a STYLY tool on a tablet at VivaTech
STYLY at VivaTech, Paris

More than 10 products builtUsed by more than 25,000 people

One hour, one week, one page.

Not sure where to start? That is our job. Before proposing a tool, we look at how you work today.

  1. 1 hour

    On site, to see the work.

    We watch with you: who does what, how many times a day, where it gets stuck. Nothing to prepare.
  2. 1 week

    To analyse the needs.

    We count the time lost, look at the software you already have and compare the options.
  3. 1 page

    To propose the first step.

    One precise deliverable, with its scope, estimated cost and timing. You decide.

Then, if you decide to go ahead, we build one tool at a time and test it with your team.

Your questions, and what we put in place.

The five questions we hear most often, with the concrete answer to each.

Where do we start?
We look with you at what takes time and what can be simplified first.
What is slowing us down?
Checks, searches, double entry: we count them with you, automate the tasks that cost the most time, and measure the time saved.
Which tool do we need?
For example, stock that updates automatically: your salesperson sees what is available without calling the warehouse. We look at your current software first.
What should we do with AI?
We pick one precise use to test, if it answers a need, then build the tools that set you apart.
How do we reach more customers?
A website or online shop that presents your offer clearly, with search visibility worked on so you are easier to find.

Tools you can try.

Compare an image, read a dashboard, turn a 3D model and follow an order. These demonstrations use fictitious data, and their labels are in French.

Même salon avec le canapé à motif visualisé par STYLYAvec le produit
Comparer la visualisation du produit

Interactive visualisation

Compare a product in its setting before choosing.

Vue d’ensembleDémo · données fictives
Choisir le tableau de bord

Consommation énergétique

4 490 kWh

Consommation sur la période · janvier–juin
Consommation énergétique — exemple fictif, de janvier à juin
MoiskWh
Jan.920
Fév.840
Mars780
Avr.710
Mai650
Juin590

Une vue commune pour comparer les périodes et repérer les écarts.

Dashboards & activity tracking

Energy, operations, business indicators: your data brought together in one clear view.

Configurer un produit en 3D.

Tournez le modèle, comparez les teintes et inspectez sa structure. Cet exemple montre une présentation produit interactive.
  1. Product photos
  2. 3D modeling & review
  3. Interactive product view
Préparer une présentation 3D
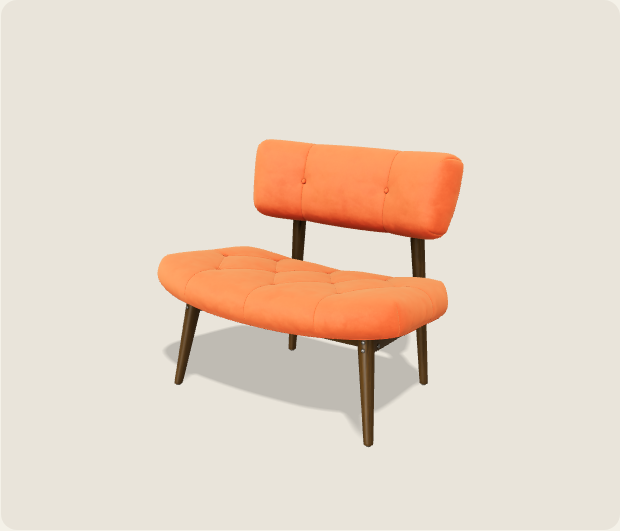
Vue interactiveSheen Chair · Sample model
Wood-framed chair with a velvet seat, available to explore in 3D

Sample model: Sheen Chair by Wayfair / Eric Chadwick (CC0). Presentation demo, not a STYLY-generated product. Model source

Sales, stock, preparation.

Confirm an order for four chairs: reservations and availability update across the three views.

Exemple d’outil métierDémo interactive · données fictives
Atelier mobilier Opérations

Vue d’ensemble

Les informations utiles à la prochaine décision.

À confirmer
1commande
Disponibles
23unités
À surveiller
1article

Faites défiler le tableau pour voir toutes les colonnes.

Disponibilité des articles

3 références
Stocks fictifs : le disponible est égal au stock physique moins les quantités réservées.
ArticleEn stockRéservéDisponible
Chaise d’atelierCH-0118612
Table en chêneTB-02927
Lampe de bureauLM-03514À surveiller

Disponible = stock physique − quantités réservées.

Ensemble du stock

32 unités physiques
Disponibles23Réservées9

Journal du scénario

  1. CMD-1043 attend confirmation : 4 chaises.
Scénario illustratif, sans connexion à un ERP réel.
  • Custom business tools
  • Automation of repetitive tasks
  • Applications & AI
  • Structured data
  • E-commerce
  • Online presence
  • SEO / GEO
  • Google
  • Claude Partner Network
  • NVIDIA Inception Program
  • AWS Startups
  • L’EscalatorOur incubator
  • Team based at L’Escalator (JCDecaux Holding), Paris.
  • Project recognised as innovative, Préfecture d’Île-de-France, 2025.
  • Analysis carried out according to the IIBA® BABOK® Guide.

Let’s talk about your business.

Tell us what you do and what takes your time. We agree on one hour at your premises to look at the work.

Duhan Koyuncu · +33 7 68 43 25 06 · contact@styly.io

STYLY for Business — We analyse your operations and build your digital tools